Quick answer
Compound interest formula: A = P(1 + r/n)^(nt). Example: $10,000 at 8% compounded monthly for 10 years = $22,196 - earning $12,196 in interest, more than doubling the original principal.
How to use this compound interest calculator
Enter your Principal (starting amount), Annual Interest Rate as a percentage, and Time Period in years. The Compounding Frequency defaults to 12 (monthly) - change it to 1 for annual, 4 for quarterly, 365 for daily, or any other value. The calculator shows future value, total interest earned, and a year-by-year growth table (up to 20 years).
Compare two scenarios: click the Compare two scenarios button below the inputs. A second set of inputs (Scenario B) opens, pre-filled from your current values with the time period automatically reduced - the most common comparison.
Edit any field in Scenario B - a different rate, a shorter or longer timeline, a larger principal - and both results appear side by side with the exact dollar and percentage difference shown below them. Click the button again to return to the standard view.
How to understand compound interest?
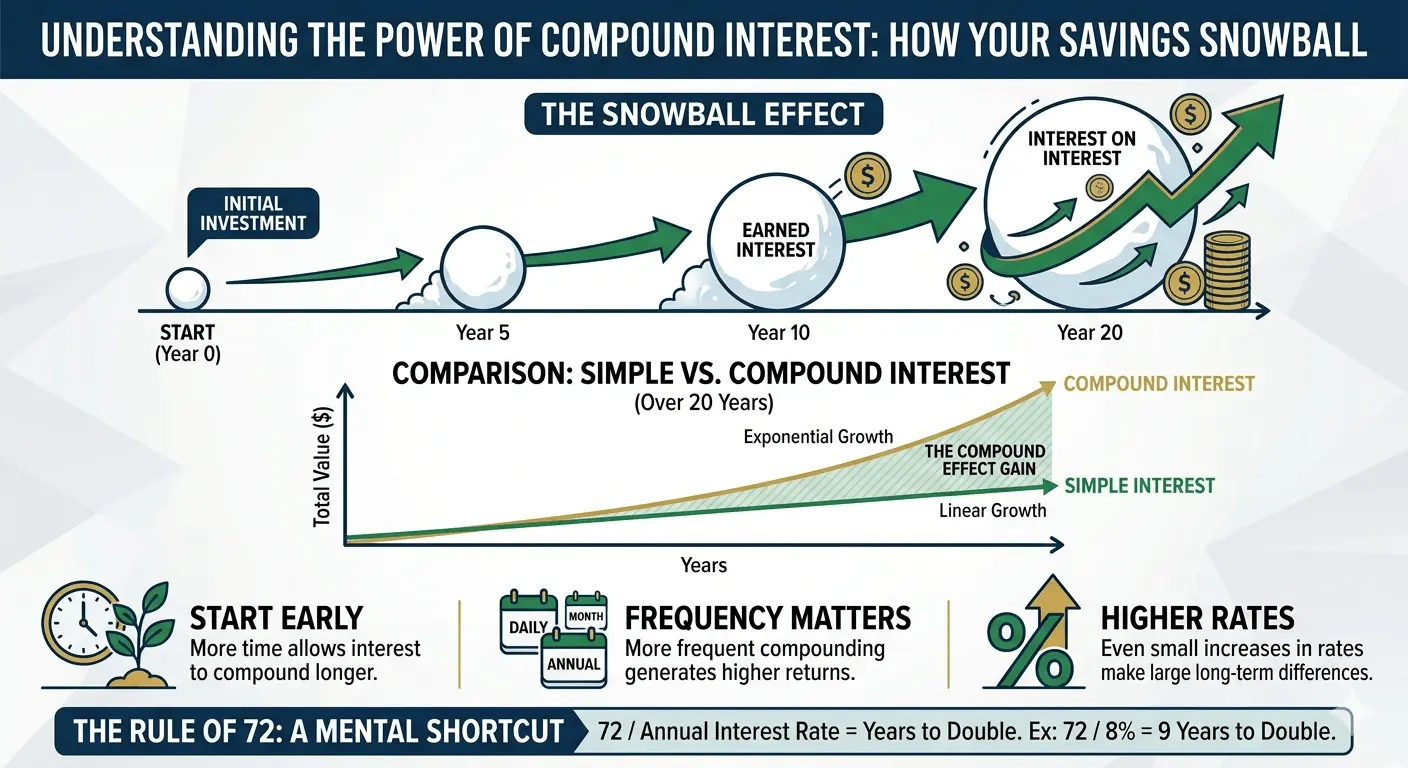
To understand compound interest, think of it as "interest on interest." While simple interest only grows based on your original deposit (the principal), compound interest allows your wealth to snowball because you earn returns on the money you've already earned.
The core concept: The snowball effect
Imagine you have $100 and earn 10% interest annually.
- Year 1: You earn $10. Your total is now $110.
- Year 2: You don’t just earn 10% on your original $100; you earn 10% on the new total of $110. You earn $11, making your total $121.
- Year 3: You earn 10% on $121, which is $12.10. Your total is now $133.10.
Over time, the "interest" portion of your account becomes the primary driver of growth, rather than your initial contribution.
The compound interest secret
The biggest "secret" to compound interest is starting early. Because the growth is exponential, the curve starts slow and then shoots upward.
A person who saves a small amount starting at age 20 will often end up with more money than someone who saves a large amount starting at age 40, simply because the 20-year-old gave the "interest on interest" more time to work its magic.
Compound interest explained to a beginner
Think of compound interest like hiring a team that grows itself. You start with $10,000 - that is your starting crew.
In Year 1 at 8%, the crew earns $800 and those new workers join the team. In Year 2, the whole crew of $10,800 works for you, earning $864 - not the original $800, because the new workers are pulling their weight too. Year 3 adds $933. Year 4 adds $1,007. Each year the crew is slightly larger, so each year the new additions are slightly bigger.
The math makes this concrete. $10,000 at 8% compounded annually: Year 1 = $10,800, Year 2 = $11,664, Year 3 = $12,597, Year 10 = $21,589, Year 30 = $100,627.
Simple interest at the same rate: Year 1 = $10,800, Year 10 = $18,000, Year 30 = $34,000. Both start identically. By Year 10 the compound balance is $3,589 ahead. By Year 30 it is $66,627 ahead - a gap that never existed at Year 1 and only emerged because interest kept compounding onto interest.
The implication is counterintuitive: the last 10 years of a 30-year investment add more dollar value than the first 20 combined. The $10,000 balance after Year 20 is $46,610 - meaning the final decade alone adds $54,017 (from $46,610 to $100,627). This is why time, not rate, is the variable that changes long-term outcomes the most.
Compound interest formula
The compound interest formula calculates the future value of a lump-sum investment growing at a constant rate:
$$A = P\left(1 + \frac{r}{n}\right)^{nt}$$
Where:
- A = future value (the end balance)
- P = principal (the starting amount)
- r = annual interest rate as a decimal (e.g., 8% = 0.08)
- n = number of compounding periods per year (12 = monthly, 365 = daily)
- t = time in years
For continuously compounding interest - where n approaches infinity - the formula simplifies to:
$$A = Pe^{rt}$$
Where e ≈ 2.71828 is Euler's number. Continuous compounding is used in theoretical finance and derivatives pricing; it produces slightly more interest than daily compounding.
Compound vs. simple interest
Simple interest applies only to the original principal (original amount). Compound interest applies to the principal plus all previously accumulated interest - creating exponential growth instead of linear growth.
$$A_{\text{simple}} = P(1 + rt)$$
| $10,000 at 8% | 5 Years | 10 Years | 20 Years | 30 Years |
|---|---|---|---|---|
| Simple interest | $14,000 | $18,000 | $26,000 | $34,000 |
| Compound (annual) | $14,693 | $21,589 | $46,610 | $100,627 |
| Compound (monthly) | $14,898 | $22,196 | $49,268 | $109,882 |
The gap between simple and compound interest widens dramatically over long time horizons. At 30 years, monthly compounding produces more than three times the balance of simple interest on the same principal and rate.
Compounding frequency
More frequent compounding produces a slightly higher effective annual rate (EAR), also called the Annual Equivalent Rate (AER). The effective annual rate at a 10% nominal rate:
| Frequency | n (periods/year) | Effective Annual Rate | $10,000 after 1 year |
|---|---|---|---|
| Annually | 1 | 10.000% | $11,000 |
| Semi-annually | 2 | 10.250% | $11,025 |
| Quarterly | 4 | 10.381% | $11,038 |
| Monthly | 12 | 10.471% | $11,047 |
| Weekly | 52 | 10.506% | $11,051 |
| Daily | 365 | 10.516% | $11,052 |
| Continuously | ∞ | 10.517% | $11,052 |
The difference between monthly and daily compounding is less than $5 on $10,000 per year. The meaningful decision is between annual compounding (e.g., some bonds) and more frequent compounding (savings accounts, most mortgages).
I notice the most common input error on this calculator is setting the compounding frequency to 1 (annual) when the account actually compounds monthly (12).
A savings account at 4.5% compounded monthly produces an effective annual rate of 4.594% - a small difference per year, but over 20 years on $10,000 the gap adds up.
More importantly, many users paste in a rate from bank marketing material that states the nominal annual rate, not the EAR. In my experience, checking the account terms for the actual compounding frequency is worth a moment - most banks state it explicitly in their product disclosures.
Worked examples for compound interest
| Scenario | Principal | Rate | Frequency | Years | Future Value | Interest Earned |
|---|---|---|---|---|---|---|
| Retirement savings | $50,000 | 7% | Monthly | 30 | $380,613 | $330,613 |
| College fund | $20,000 | 6% | Quarterly | 18 | $58,045 | $38,045 |
| High-yield savings | $5,000 | 4.5% | Daily | 5 | $6,252 | $1,252 |
| Business investment | $100,000 | 10% | Annual | 10 | $259,374 | $159,374 |
One pattern I see repeatedly: people treat compounding frequency as the most important variable to optimise, when time is far more powerful.
The worked examples show $50,000 at 7% growing to $380,613 over 30 years. Starting the same investment 5 years later - 25 years instead of 30, same rate, same principal - produces $272,261. That is a $108,352 difference from a single 5-year delay, more than twice the original principal.
In my experience, the most useful thing to run on this calculator is the compare two scenarios feature: once with the actual intended timeline, and once with a timeline 5-10 years shorter, so the cost of delay is visible as a concrete dollar amount rather than an abstraction.
Rule of 72 - quick doubling estimate
The Rule of 72 estimates how many years it takes to double an investment at a given annual rate: divide 72 by the interest rate percentage.
$$t = \frac{\ln 2}{n \cdot \ln\!\left(1 + \frac{r}{n}\right)} \approx \frac{72}{r\%}$$
| Annual Rate | Rule of 72 estimate | Exact doubling time |
|---|---|---|
| 2% | 36 years | 35.0 years |
| 4% | 18 years | 17.7 years |
| 6% | 12 years | 11.9 years |
| 8% | 9 years | 9.0 years |
| 10% | 7.2 years | 7.3 years |
| 12% | 6 years | 6.1 years |
The rule also works in reverse: if prices double every 9 years, implied inflation is roughly 72 / 9 = 8% per year. It is a mental math shortcut accurate to within 1–2% for rates between 3% and 15%.
FAQs about compound interest
What is compound interest?
Compound interest is interest calculated on both the original principal and all previously earned interest. Because interest earns interest, balances grow exponentially rather than linearly - this is the core mechanism behind long-term wealth accumulation.
What is the compound interest formula?
A = P(1 + r/n)^(nt), where A is the future value, P is the principal, r is the annual rate as a decimal, n is compounding periods per year, and t is years. For monthly compounding at 8% on $10,000 for 10 years: A = 10,000 × (1 + 0.08/12)^(120) = $22,196.
How does compounding frequency affect interest?
More frequent compounding yields slightly more interest. At 10% on $10,000 for one year: annual compounding = $11,000; monthly = $11,047; daily = $11,052. The difference between monthly and daily is negligible. The more important factor is starting early - time has a much larger effect than compounding frequency.
What is the Rule of 72?
Divide 72 by your annual interest rate to estimate the years needed to double your money. At 6%: 72 / 6 = 12 years. At 9%: 72 / 9 = 8 years. This is an approximation; the exact time is ln(2) / [n × ln(1 + r/n)].
What is the difference between compound and simple interest?
Simple interest applies only to the original principal: A = P(1 + rt). Compound interest applies to principal plus accumulated interest. On $10,000 at 8% for 30 years: simple interest = $34,000 total; compound monthly = $109,882 - more than 3× as much.
What does compounding monthly vs. annually mean?
Monthly compounding (n=12) means interest is calculated and added to the balance 12 times per year, at 1/12 of the annual rate each time. Annual compounding (n=1) adds interest once per year at the full annual rate. Monthly compounding produces a higher effective annual rate and a larger balance over time.
Can I compare two compound interest scenarios side by side?
Yes. Click Compare two scenarios below the main inputs. A Scenario B panel opens pre-filled from your current values - with the time period shortened automatically to make the "cost of starting later" comparison the default. Change any input in Scenario B (rate, years, principal, or compounding frequency) and both future values update instantly. A summary line shows which scenario comes out ahead and by how much in dollars and percentage. Click the button again to dismiss Scenario B and return to the standard view.
Quiz: how well do you know compound interest?
1. What does the variable 'n' represent in the compound interest formula A = P(1 + r/n)^(nt)?
2. According to the worked examples table on this page, what is the future value of $50,000 invested at 7% compounded monthly for 30 years?
3. Why does the page conclude that time is a more powerful variable than compounding frequency?
4. According to the compound vs simple interest comparison table on this page, what is the future value of $10,000 at 8% compounded monthly for 30 years?
5. What does the page identify as the most common input error on this calculator?